Data Presentation
Filter by
SubjectRequired
LanguageRequired
The language used throughout the course, in both instruction and assessments.
Learning ProductRequired
LevelRequired
DurationRequired
SubtitlesRequired
EducatorRequired
Results for "data presentation"
 Status: Free Trial
University of California, Davis
Skills you'll gain: Data Storytelling, Data Presentation, Dashboard, Data Visualization, Stakeholder Analysis, Tableau Software, Data Visualization Software, Requirements Analysis, Stakeholder Management, Data Cleansing, Storyboarding, Data Manipulation, Data Quality
 Status: Free Trial
Rice University
Skills you'll gain: Statistical Hypothesis Testing, Microsoft Excel, Pivot Tables And Charts, Regression Analysis, Statistics, Descriptive Statistics, Probability & Statistics, Graphing, Spreadsheet Software, Probability Distribution, Business Analytics, Statistical Analysis, Statistical Modeling, Statistical Inference, Excel Formulas, Data Analysis, Data Presentation, Business Analysis, Statistical Methods, Sample Size Determination
 Status: Free Trial
Microsoft
Skills you'll gain: Data Storytelling, Power BI, Data Presentation, Dashboard, Data Visualization Software, Data Visualization, Interactive Data Visualization, Statistical Visualization, Data Analysis, Creative Design, Data Security, Real Time Data, Geospatial Mapping
 Status: NewStatus: Free Trial
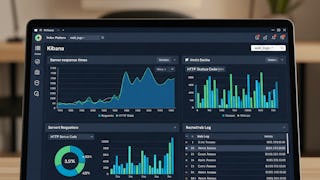
Skills you'll gain: Dashboard, Interactive Data Visualization, Business Analytics, Data-Driven Decision-Making, Data Presentation, Kibana, Data Analysis, Data Visualization Software, Exploratory Data Analysis, Trend Analysis, Retail Sales, Data Import/Export, System Configuration
 Status: NewStatus: Free Trial
Skills you'll gain: Kibana, Dashboard, Interactive Data Visualization, Data Presentation, Data Storytelling, Web Analytics, Data Visualization Software, Exploratory Data Analysis, Data Analysis, Business Intelligence, Data Import/Export
 Status: Free Trial
Vanderbilt University
Skills you'll gain: Prompt Engineering, ChatGPT, Generative AI Agents, Prompt Patterns, Generative AI, LLM Application, Ideation, Verification And Validation, Data Presentation, Productivity, OpenAI, AI Personalization, Document Management, Responsible AI, Agentic systems, Tool Calling, Artificial Intelligence, Personalized Service, Large Language Modeling, Software Development
 Status: Free Trial
University of California, Santa Cruz
Skills you'll gain: Time Series Analysis and Forecasting, Bayesian Statistics, R Programming, Forecasting, Statistical Inference, Statistical Modeling, Technical Communication, Data Presentation, Statistics, Probability, Statistical Analysis, Statistical Software, Advanced Analytics, R (Software), Data Analysis, Mathematical Modeling, Microsoft Excel, Markov Model, Statistical Methods, Data Science
 Status: Free Trial
University of California, Davis
Skills you'll gain: ArcGIS, GIS Software, Spatial Analysis, Data Storytelling, Spatial Data Analysis, Geographic Information Systems, Data Presentation, Geospatial Mapping, Public Health and Disease Prevention, Public Health, Land Management, Geospatial Information and Technology, Heat Maps, Data Sharing, Epidemiology, Community Health, Metadata Management, Image Analysis, Project Management, Global Positioning Systems
 Status: Free Trial
Vanderbilt University
Skills you'll gain: Prompt Engineering, ChatGPT, Prompt Patterns, Ideation, Verification And Validation, Data Presentation, LLM Application, Productivity, OpenAI, Generative AI, Document Management, Responsible AI, Data Synthesis, Image Analysis, Data Capture, Large Language Modeling, Data Analysis, Organizational Skills, Risk Management Framework, Artificial Intelligence
 Status: Free Trial
University of California, Davis
Skills you'll gain: SQL, Data Quality, Complex Problem Solving, Data Visualization, JSON, Query Languages, Business Metrics, Business Reporting, Data Cleansing, Data Presentation, Forecasting, Data Analysis, Predictive Analytics, Debugging
 Status: Free Trial
Skills you'll gain: Power BI, Microsoft Copilot, Data Visualization Software, Data Modeling, Data Presentation, Interactive Data Visualization, Data Analysis, Microsoft Power Platform, Microsoft Azure, Data Manipulation, Data Transformation, Data Cleansing, Data Import/Export, Test Planning, Performance Tuning
 Status: Free Trial
Tableau Learning Partner
Skills you'll gain: Data Literacy, Tableau Software, Business Analysis, Business Process, Analytics, Business Analytics, Business Intelligence, Data Analysis, Data-Driven Decision-Making, Project Management, Data Presentation, Descriptive Analytics, Predictive Analytics